
When Ridership and Revenue is down
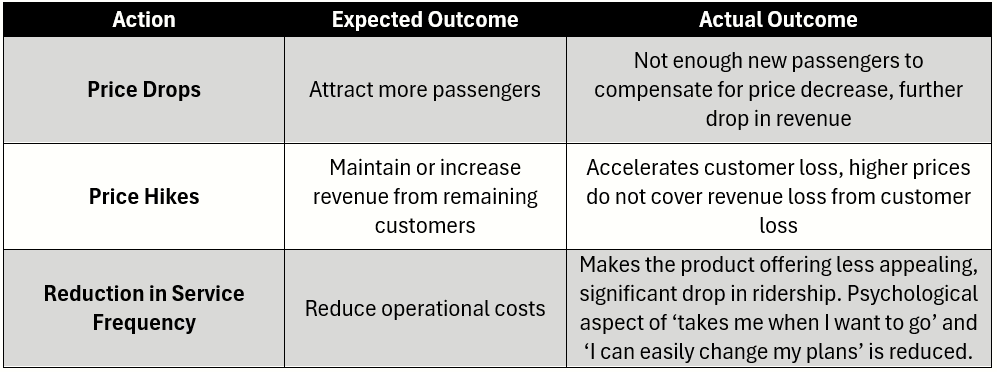
Drop fares? Pull service? Jack-up prices? What should you do when the passenger and revenue numbers are down?


When ridership and revenue drops on scheduled services in competitive markets, the remedies often immediately put on the table are:
Reduce schedules – to take cost out, and/or
Reduce prices – to encourage demand, or
Increase prices – to get more yield per passenger and total revenue
However the actual outcomes from such reactions may not be as expected as demonstrated here:
We need to look at the market as a whole to fully understand what is happening and where we stand in that ecosystem.
Your shortfalls may be due to the market shrinking (think pandemic). It may be due to your piece of the market shrinking, but the market as a whole may actually be growing. Cutting schedules in this scenario would potentially be a square peg solution to plugging a round hole - it isn't the core of the issue. Often it's a combination of many things - changing competitor capacities, changing market size and changing fares.
Not understanding these will leave you shooting blindfolded in your response.
So let's get started:
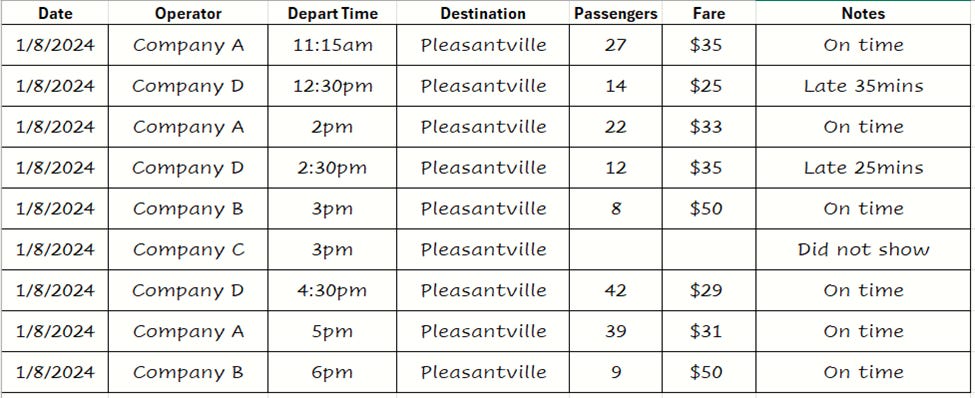
Your market share info card
You need to get out and see who you are competing against in your market, how many passengers they're carrying and what the fare levels are like. Here's an example of what can look like:
Survey Timing
There are a few guidelines to follow in surveying, illustrated in the table below. Consistency and frequency in observation activities are very important. The aim is to generate trends as well as snapshots.
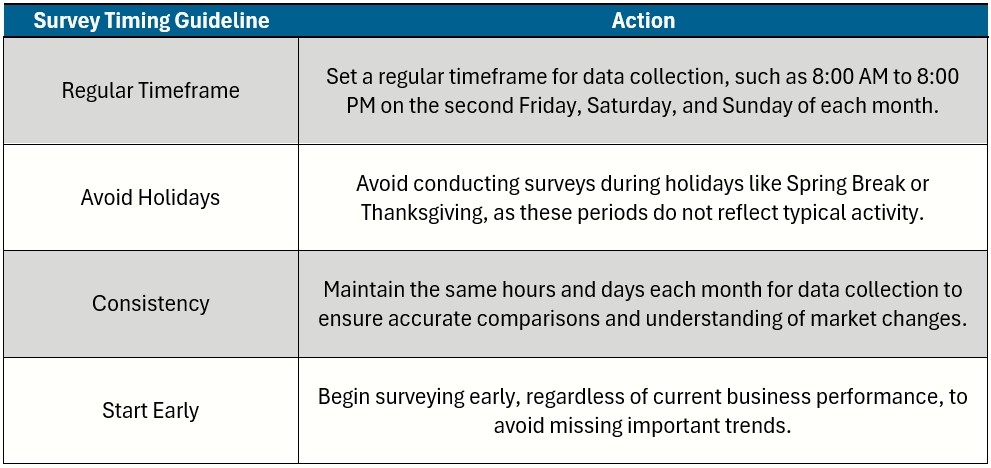
The ‘Start Early’ guideline merits further context. I’ve seen companies 'panic-survey' when they’ve already hit the ‘intensive care’ status. While better late than never, you’ll only get a snapshot in time, lacking the context of whether your piece of the pie has been changing over time and/or the size of the pie overall.
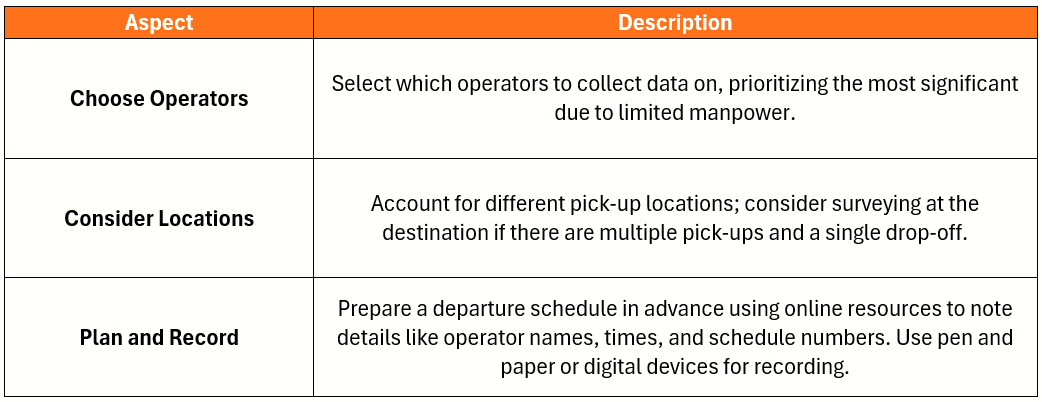
What and When to Survey?
On survey days, you do not want gaps in the days observations. It’s not ok to skip the lunch hour so your data collector can eat – find a way to cover the gap. Consistency is key, and even more so when it comes to comparing one month to the next. The table below summarizes the 'whats' and 'whens':
When you've collected a weekends worth of observations, you’ll then be able to build out some simple analysis such as size of the market and share of capacity in the market for that point in time.
Reducing schedules, or even exiting may be wiser where a market overall is contracting and your slice of it and fares are already low.
Reducing pricing may be considered if the market large, your fares are high, but your share of the pie is low.
Increasing pricing and/or schedules may be merited if you’re enjoying good market share and it’s consistent or improving across multiple months.
So, should you drop prices, increase fares, reduce schedules? You can’t really answer these questions if you don’t have the market data. So get collecting now!
Worked Example:
In this example, we’ve been consistently conducting market shares for 3 months in a market. Each color represents an operator in a particular market, of which there are 4 in total. We looked at Jan, Feb and March 2024.
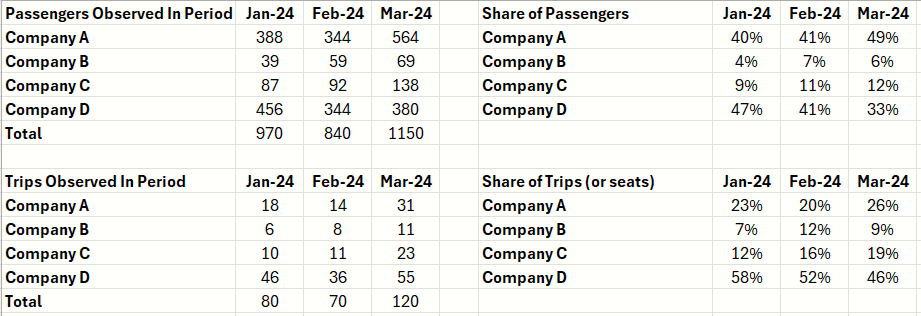
We used our collected data to develop the following comparative metrics:
% of Total Pax – The share of passengers this month vs other operators observed
% of Departures – The share of departures (or capacity) offered.
We're ignoring fare comparisons for now, but these are certainly a major consideration in what we do going forward after analysing the information.
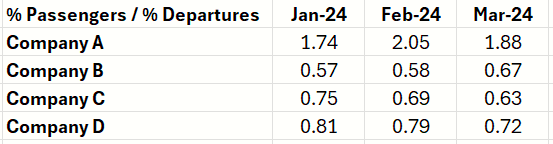
A value greater than 1.0 indicates that you are carrying a higher percentage of passengers compared to the capacity you offer. This suggests that your services are more popular and/or efficient in filling seats than the market average. This is almost always good – assuming your fares are at acceptable contribution levels. You're carrying more than your fair share of supply!
A value less than 1 indicates that you are carrying fewer passengers relative to the capacity you offer, suggesting underutilization (compared to the market average), or lower preference for your services compared to the market average. Cost and revenue need to be considered of course, but so too are the trends of the numbers:
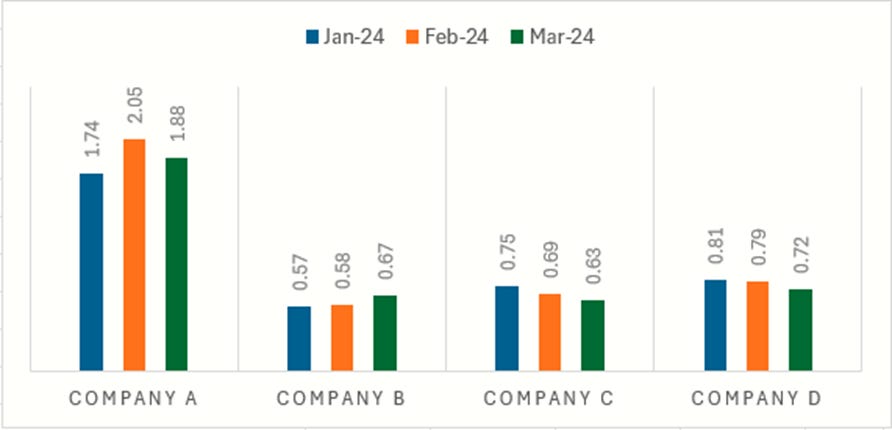
The 4 different companies are experiencing slightly differing trends. Company A may very well choose to do nothing with their information, given their relatively strong position. Companies C and D need to review and act, particularly if they’re not profitable at their current fare levels. Company B is trending in the right direction, albeit slowly, so may also take actions that lean more towards the marketing and pricing end, rather than cut schedules.
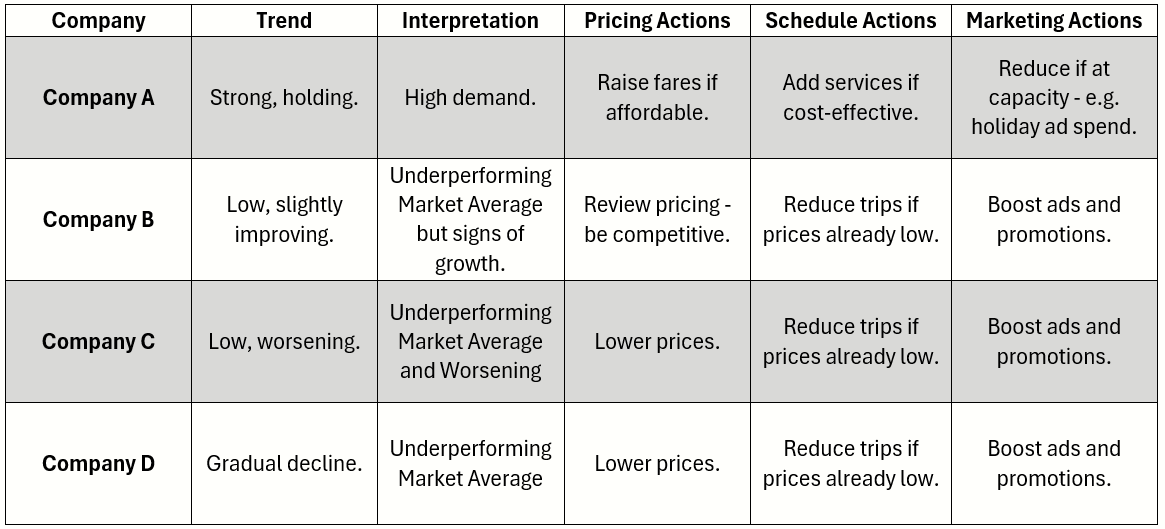
Of course, there are many more interpretations that can be taken from the information above, but the key is setting up the process, keep the data gathering consistent, and looking at the stories being told by the data. You’ll then be far better informed to make sustainable decisions within your organization and not default to cut, hike or drop.